Target reports $106 billion in total revenue for 2021, a rise of 35 percent since 2019, sees growth across
core categories.
MINNEAPOLIS -- Target Corporation (NYSE: TGT) today announced its fourth-quarter and full-year 2021 results. The Company reported fourth-quarter GAAP earnings per share (EPS) from continuing operations of $3.21, compared with $2.73 in 2020, and $14.10 for full-year 2021, compared with $8.64 in 2020. Adjusted EPS was $3.19 for the fourth quarter, compared with $2.67 in 2020, and $13.56 for the full-year, compared with $9.42 in 2020. Full-year GAAP EPS included a $335 million pretax gain on the sale of Dermstore, which was excluded from Adjusted EPS. The attached tables provide a reconciliation of non-GAAP to GAAP measures. All earnings per share figures refer to diluted EPS.
“Our strong fourth-quarter performance capped off a year of record growth in 2021, reinforcing the durability of our business model and our confidence in long-term profitable growth,” said Brian Cornell, chairman and CEO of Target. “As we look ahead, we’ll keep investing and delivering on all that has earned the loyalty and trust of our guests; that starts with our outstanding team and includes continued differentiation through affordability, assortment, ease and convenience.”
Q4 2021 Highlights
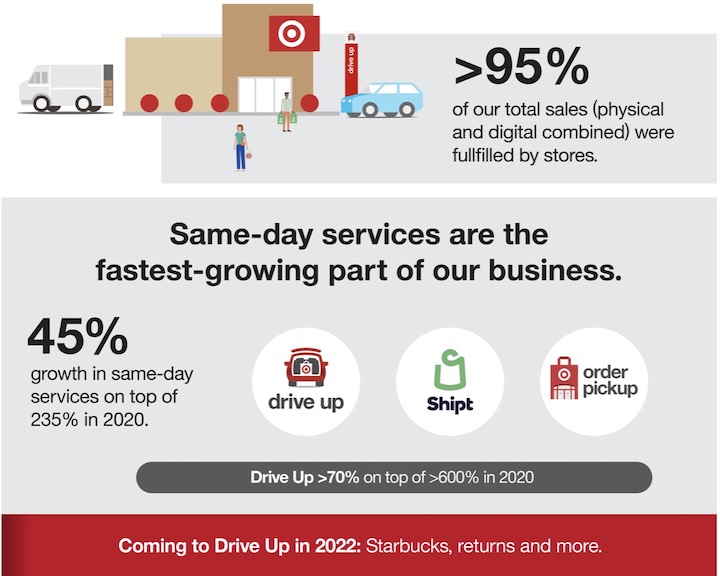
More than 95 percent of total sales were fulfilled by Target stores in Q4 2021. The company plans to add drive up
Starbucks and returns in 2022.
-- Comparable sales grew 8.9 percent, on top of 20.5 percent in Q4 2020.
-- Comparable traffic grew 8.1 percent on top of 6.5 percent in Q4 2020.
-- More than 95 percent of Target’s fourth quarter sales were fulfilled by its stores.
-- EPS established an all-time high with GAAP EPS of $3.21 and Adjusted EPS1 of $3.19, despite significant investments in team, price, and inventory availability.
Full-Year 2021 Highlights
-- Target delivered $106 billion in total revenue, having grown nearly $28 billion, or more than 35 percent over the past two years.
-- Comparable sales grew 12.7 percent, on top of 19.3 percent in 2020.
-- Comparable traffic grew 12.3 percent, on top of 3.7 percent in 2020.
-- Total sales have grown more than $27 billion since 2019, reflecting more than $14 billion of additional store sales and digital sales growth of nearly $13 billion.
-- All five core merchandise categories delivered double-digit comparable sales growth in 2021, on top of unprecedented growth in 2020.
-- Operating income margin rate of 8.4 percent expanded nearly 150 basis points from 2020.
-- GAAP EPS from continuing operations of $14.10 was 63.1 percent higher than last year, while Adjusted EPS of $13.56 grew 44.0 percent compared with 2020. Both GAAP and Adjusted EPS have more than doubled since 2019.
Fiscal 2022 Guidance and Quarterly Commentary
For fiscal year 2022, the Company expects low- to mid-single digit revenue growth, an operating margin rate of 8 percent or higher, low-single digit growth in operating margin dollars, and high-single digit growth in Adjusted Earnings per Share.
The Company expects quarterly, year-over-year profit performance will be variable during the year, and generally improve as the year progresses. The Company expects its first quarter 2022 operating margin rate will be favorable in relation to historical performance, but well below its first quarter 2021 rate of 9.8 percent.
Long-Term Financial Algorithm
Target has also updated its long-term financial algorithm, which will define the Company’s expectations for annual performance in fiscal years 2023 and beyond. The algorithm specifies annual benchmarks for the following metrics:
-- Mid-single digit growth in Total Revenue;
-- Mid-single digit growth in Operating Income;
-- High-single digit growth in Adjusted EPS;
-- CAPEX of $4 to $5 billion; and
-- After-tax Return on Invested Capital in the high-20% to 30% range.
Operating Results
The Company’s total comparable sales grew 8.9 percent in the fourth quarter, reflecting comparable stores sales growth of 8.9 percent and digital sales growth of 9.2 percent. Total revenue of $31.0 billion grew 9.4 percent compared with last year, driven by sales growth of 9.4 percent and an 11.1 percent increase in other revenue. Operating income was $2.1 billion in fourth quarter 2021, up 14.1 percent from $1.8 billion in 2020.
Fourth quarter operating income margin rate was 6.8 percent in 2021 compared with 6.5 percent in 2020. Fourth quarter gross margin rate was 25.7 percent, compared with 26.8 percent in 2020, reflecting pressure from increased supply chain costs due to increased compensation and headcount in the Company's distribution centers as well as higher freight and merchandising costs. Fourth quarter SG&A expense rate was 17.9 percent in 2021, compared with 19.2 percent in 2020, reflecting the benefit of leverage resulting from strong revenue growth.
Full-year sales increased 13.2 percent to $104.6 billion from $92.4 billion last year, reflecting a 12.7 percent increase in comparable sales combined with sales from non-mature stores. Full-year revenue of $106.0 billion grew 13.3 percent compared with 2020, reflecting sales growth of 13.2 percent and a 20.2 percent increase in other revenue.
Full-year operating income was $8.9 billion in 2021, an increase of 36.8 percent from $6.5 billion last year. Full-year gross margin rate was 28.3 percent, in line with 28.4 percent in 2020, reflecting pressure from increased supply chain, merchandise, and freight costs largely offset by favorable category mix and lower markdowns. Full-year SG&A expense rate was 18.6 percent in 2021, compared with 19.9 percent in 2020, reflecting significant leverage on fixed costs that offset investments in team member pay and benefits.
Interest Expense and Taxes
The Company’s fourth quarter 2021 net interest expense was $104 million, in line with $106 million last year.
Full-year 2021 net interest expense was $421 million, compared with $977 million in 2020, which included a $512 million loss on early debt retirement.
Fourth quarter 2021 effective income tax rate was 23.4 percent, compared with 20.2 percent last year. The Company’s full-year 2021 effective income tax rate from continuing operations was 22.0 percent compared with 21.2 percent in 2020. This increase was driven by significantly higher earnings, which diluted the benefit of fixed and discrete tax items.
Capital Deployment and Return on Invested Capital
The Company paid dividends of $432 million in the fourth quarter, compared with $341 million last year, reflecting a 32.4 percent increase in the dividend per share, partially offset by a decline in average share count.
The Company repurchased $2.3 billion worth of its shares in fourth quarter 2021, retiring 9.7 million shares of common stock at an average price of $237.00. As of the end of the fourth quarter, the Company had approximately $12.3 billion of remaining capacity under the repurchase program approved by Target’s Board of Directors in August 2021.
For the trailing twelve months through fourth quarter 2021, after-tax return on invested capital (ROIC) was 33.1 percent, compared with 23.5 percent for the twelve months through fourth quarter 2020. This increase was driven primarily by increased profitability. The tables in this release provide additional information about the Company’s ROIC calculation.